Monday, March 30, 2009

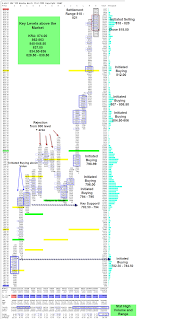
Daily Chart for Monday


Hi guys,
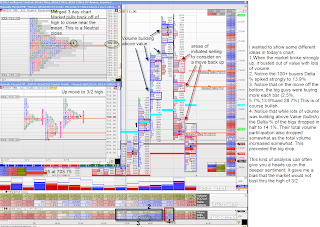
Here is my 30 minute chart for Monday and levels to watch tomorrow. Also, a reminder that Don Jones is giving a free talk at IOAMT's trading. This talk is free but you need to register at support@ioamt.com.

Here is their blurb:

Using Market Profile to Read the Market Behavior

Join The Trading Education Exchange and IOAMT for a in-depth look at Don Jones' new Anticipation Package to Pause Alerts.

Key learning points:

  • Understanding market condition (balancing or moving) as derived from the 3-day market graphic
  • Realizing the market's tendency to run-pause, i.e. move directional and consolidate.
  • Reading the market's short term run-pauses within the trading day.

March 31 (4:30 EST time)

Have a great day tomorrow,

MG

Sunday, March 29, 2009

1.25 Range Chart Perspective


Hi guys,
I wanted to add another micro view of the trade off the low that I chronicled in my last post. This is the same trade from the perspective of a 1.25 Range Chart. In this case, check out the additional cues you get from using a the footprint style bars and the Volume Breakdown indicator that Market Delta offers. I think it's a really cool chart example and (as you can see) really helped me on this particular trade.

Hope it helps,

MG

Friday, March 27, 2009

Nice Trade from Low/Multiple Views


Hi there guys,
What a strange and slow day it was today. Here is a very nice trade from the Low of Day. I have given you multiple chart views to give you an idea of my thinking on this trade. Start with the top chart and work your way down.

Once again, Market Delta charts from the new 9.2 version gave me an excellent heads up for a possible reversal. Auction Market theory and the Footprints (Volume at Price Charts) rule.

Have a great weekend.

MG

Thursday, March 26, 2009

Thursday's Chart and Levels


Hi Guys,
Hope you had a successful day. Here is a slightly different way to look at the 30 minute chart. This is a Market Delta chart with Total Volume and manual shading. I experiment with different footprint types and setups to help me better see the big volume clusters more easily. Market Delta has an amazing variety of options and possibilities. Check out what works best for you.

Enjoy,

MG

Tuesday, March 24, 2009

Daily Chart for Tuesday


Hi there guys,
I am posting my 30 minute chart for the day. As you know, this is where I get my levels. I don't plan on posting these every day. My hope is that you are doing your own version of this type of chart. If you don't have Market Delta or some other software that gives you volume at price, you can't get this data. For me, I couldn't live without it. If you haven't tried Market Delta 9.2, what are you waiting for? Trevor and the guys there have done an amazing job making their great software a quantum leap better.

Anyway, I hope these charts that I post help.

MG

Monday, March 23, 2009

Daily Chart for Monday


Hi guys,
Tonight, I've got a chart for you with today's levels and the levels I am looking at above the market. I used an IOAMT chart, which is really nice to work with, for the data. Enjoy.

MG

Friday, March 20, 2009

Bill Duryea Class Tomorrow

Hi again,
Just a reminder that Bill Duryea of IOAMT is doing a class tomorrow. Here is the info:

The Institute of Auction Market Theory is excited to announce a 4 hour workshop on the Basic Axioms of Auction theory. The workshop is based on the DVD and will be on Saturday 3/21/09 at 8:00am PST. It will be conducted in our Live Trading Room. It will be about 4 hours long and will cost $495.00 for both the workshop and the DVD.

Basic Axioms of Auction Market Theory will encompass all the necessary knowledge needed to acquire the skills to become a discretionary trader and will cover:
Trend
Consolidation
The 4 steps
Bell curve
How to read the data and interpret it
And much, much more.

To get the DVD with free shipping and handling and the workshop for the low cost of $495.00 click here.

For those of you who have already purchased the DVD and would like to take the workshop it will be $100 you can confirm your spot by contacting support for the link. If you took the workshop in the past and would like a copy of the DVD or would like to attend the new workshop, there will be a nominal fee.

Contact Michelle at support@ioamt.com for the details and proper links.

At IOAMT we believe education is an on going endeavor that requires constant sharpening and fine tuning. The workshop is about 4 hours long and we will allow questions at the end. It covers so much in so little time you will want to own the DVD so you can go through it over and over again at your own pace.

Those of you currently on trial and planning on subscribing to our site, we encourage you to do so before your trial expires. If you subscribe to the room before the end of your trial you will receive an Educational DVD Free!

Click here for more information http://www.ioamt.com/?page=ioamtdvd.

If you have any questions or would like to confirm your spot as space is limited, please contact support@ioamt.com

Thanks,

Michelle Hoyle
Customer Relations

Footprint Lesson


Hi guys,
I have been very busy with my 'other' job this week and haven't had a chance to trade much or post this week. I hope this chart helps make up for that. I took a short trade at 780 today and got a nice 11 points out of it. I had my 780 level in mind for several weeks and showed the level as the top of a 5 day balance area in my ' Looking at the Longer Term Picture' post from last Friday. I got a chance to short it today and the Footprint chart gave me all the insight I needed to feel comfortable to take it.

You may notice that I am looking here at a slightly different view of the 6 Reversal Chart. I love this setup because it really allows me to see strong Supply (dark red) and strong Demand (dark blue) very easily.

I am showing it here in the Classic Footprint chart but you can also set it up in the new multi-pane Footprints. Here is how I set this up. I choose 'Shade Dominant Side' leaving 'Shade Text Only' unchecked. Under Colors, I choose 'Manual Shading,' Level 1: 500, Level 2: 750 and Level 3: 900. Ask Volume Color: Blue, Bid Volume: Red, Total volume Color: Gold.

This sets the color changes based on Delta. These are the settings I am using but feel free to set it to your liking. For me, I just 'see' the supply and demand so much easier.

Hope this helps. have a great weekend.
Publish Post


MG

Sunday, March 15, 2009

Friday's 30 Minute Volume at Price Chart


Hi Guys,
Here is my 30 minute chart for Friday. I do something like this (and more) following every trading day. I digitally store these charts in my computer in my Chart Book and I also print this one out. This can help me not only on the following trading day. Since it is only possible to save 5 -10 days of tick data with Esignal or IQFeed, this data can come in very handy in the future if the market returns to these levels.

There is no 'proper' way to do these charts or a Chart Book. I experiment all the time to make it work better for me. Remember please, that I am just learning also.

If you are not doing this kind of homework for yourself, you are missing out on a great learning and research tool.

Hope it helps,

MG

Friday, March 13, 2009

Looking at the Longer Term Picture


Hi guys,
Here is a very important chart. Study it closely. It was inspired by my studies with Bill Duryea of IOAMT, so kudos go to him. There are several more nuances that the chart alludes to that I haven't gone into. I talked to Bill today and he gave me permission to post a link to a recent video where he goes into the details of creating this chart and what he is seeing.

It is an excellent discussion, well worth watching. The end of the discussion was cut off when his Omnovia crashed, but the essentials are there. Here is a link: http://www.ioamt.com/media/videos/mpclub/mpmarch12/mpmarch12.html

Enjoy. Have a great weekend.

MG

Long Trade Near the Low of Day


Hi guys,
Yesterday I showed you my levels for today (Friday). I pointed out the Single print with a big clump of volume just below it. Well, we got the opportunity to take this one - and it was a real good one.

Hope it helps,

MG

Thursday, March 12, 2009

Possible Levels for Longs Tomorrow


Hi there guys,
I'm still not fully on my game but i wanted to get you something out today. Here are some levels I'll be looking at tomorrow for possible long trades, if we get a suitable retracement.

Here are some levels above the market I'll be watching for possible short opportunities: 750-52, 761.25-62.75, 766.50-67.50, 772.50-74 and 776.50-780.

Hope it helps,

MG

Hope it helps,

MG

Wednesday, March 11, 2009

Limit Orders or Footprint Confirmation?


Here was a really nice short opportunity. I broke it up into two charts to give you the setup from a 30 minute MP and regular MP perspective as well as a 6 tick Reversal confirmation. I am still recuperating from dental surgery so I didn't trade today. But, I watched this trade set up and pass me by. While I am not 100%, I really wanted to post today, as I have not had much of a chance the past number of days due to computer problems and then the surgery.

There was an interesting discussion in the IOAMT trading room today as to whether it is more beneficial to just place a limit order at at Key Area or to wait for a reversal or confirmation signal on the shorter term footprint chart.

Bill Duryea's observation was that you don't usually have to give up too much in location by waiting for the confirmation and you get a lot in return for waiting. I heartily agree. Here are my reasons:

1. Limit orders placed in advance will all too often not be filled when the market doesn't quite hit the level.
2. Limit orders may be blown thru.
3. If I can get a good location with confirmation, my odds of a winning trade go up substantially.

On the side of placing a limit order in advance, there are definitely benefits (sometimes). We have all seen the market hit a key level (often to the tick), reverse and go off to the races without us. While this is irritating for sure, I have probably seen an equal amount of times when the market doesn't quite reach my order level or (even more exasperating), hits my order without filling me - before it takes off.

Waiting for footprint confirmation keeps me on my toes, observing what the market is really saying rather than entering on a bias based only on the longer time frame. In this way, I get the best of both worlds. All in all, my preference is to wait for confirmation. As my skills in reading the volume at price charts have grown over time, this method has become comfortable and profitable. Feel free to chime in with your thoughts on this.

I hope you have been having a good trading week. I hope to be full blast by Friday.

Hope this helps.

MG

Monday, March 9, 2009

March 9 Update

Hi there guys,
Sorry I couldn't post any charts this weekend. I have been having some computer related problems. They are fixed now and I am up and running, however, I have to have dental surgery tomorrow and will be incapacitated for several days. I really look forward to resuming my regular posts - hopefully by Thursday or Friday.

I did want to let you know about some up coming classes that Bill Duryea of IOAMT is giving in the near future. I have been in Bill's room the past several weeks and am enjoying it a lot. I am learning a great deal which will show up in my future charts. I highly recommend the programs that I have experienced so far.

1st Program: 3/31/09 at 1:30pm PST
Don Jones of CISCO-futures will discuss the three step process of developing a trading strategy:
1) Understanding market condition (balancing or moving) as derived from the 3-day market graphic
2) Realizing the market's tendency to run-pause, i.e. move directional and consolidate.
3) Reading the market's short term run-pauses within the trading day.


This class is free if you register for a 5 day free trial at www.ioamt.com

2nd Program: Saturday 3/21/09 at 8:00am PST.

Basic Axioms of Auction Market Theory will encompass all the necessary knowledge needed to acquire the skills to become a discretionary trader and will cover:
Trend
Consolidation
The 4 steps
Bell curve
How to read the data and interpret it
And much, much more.

It will be about 4 hours long and will cost $495.00 for both the workshop and the DVD.

3rd Program: Saturday 4/11/09 at 8:00am PST
This is also a pay class called Anatomy of a Trade. Here is their copy on it:

It will be about 4 hours long and will cost $495.00 for both the workshop and the DVD.

To shape and fine tune our understanding of the markets must be an ongoing endeavor, wherein we challenge our previously held assumptions. This course is an opportunity to build upon the foundation of skills taught in our first DVD course Basic Axioms of Auction Market Theory and will be covered in our 4 hour workshop on 3/21/09. The focus of Anatomy is to understand pattern recognition and how to utilize that recognition with the market generated data.

Understanding Support and Resistance levels, allows a trader to make an informed inference as to the markets direction. Is the market remaining in consolidation or is it moving towards a trend? When is the trend over? These are the questions the successful trader asks themselves.

In Anatomy of a Trade, IOAMT has broken down the criteria whereby you can define the market behavior and determine when the markets are in consolidation and when they are trending. To understand and recognize when the markets are consolidating and trending is to be an educated trader.

If you are interested, you can contact Michelle at support@ioamt.com for more info or to register.

Hope this helps guys. See you in a few days.

MG

Wednesday, March 4, 2009

Looking at the Big Boys


Hi there guys,
Wanted to give you something a little different today. I have been looking at the 100+ traders for a while and am still determining how to best use this data in my trading. Here's how I used that info today

Hope it helps,

MG

Monday, March 2, 2009


Hi guys,
Hope you had a successful trading day. In these two charts, we'll look at a short from 711 area. It was a great, high probability trade: Down trending day, retracement to an established area of strong initiative selling and very, very nice 6 tick reversal chart supportive feedback. Plus, it worked for 10+ points. This is the kind of trade you need to take.

MG

Sunday, March 1, 2009

Trade (s) Near the High


Hi guys,
Here is another trade (or two or three) I liked very much. I was watching the 748-749 area. After the gap down, I didn't know if the area would provide resistance (as I was seeing it as possible support). But it stopped the market very well (in four separate periods). Even the thrust above the level into Thursday's closing range area (7 tick extension) can be seen as a fake out to draw in longs and a shake out of stops.

Please note, I am now calling the opening period A period instead of the D period as JP (of JPJ trading) calls it. This is more consistent with how most people list this. With this is mind, I and J period could also have been shorted. I haven't included the 6Rev Chart for these opportunities. I need to leave something for you to do.

Speaking of that, if you are not yet doing daily charts like this, what are you waiting for. I keep digital copies of all my charts in a chart book in a folder on my desktop. I print the ones I want to keep in mind during the trading day. Bill Duryea of IOAMT inspired me to do this and it is possibly the most valuable exercise I have ever done in my trading career. I use SnagIt which is pretty cheap and easy to use. Doing this process forces me to observe and think things out. I look at what I saw and didn't see in real time. I look at the trades I took that worked well and the ones that didn't. I look at the trades I wish I would have taken and observe the cues that were there to see in real time, if I would have had the wit to see it. It is now a habit for me to do this - one I would not want to give up. The rewards are that great.

Hope it helps,

MG

Great Trade off of dValue


Hey there guys,
Here is a trade I really liked from Friday. I hope some of you took this one. I rely heavily, as you know, on the 30 minute chart and the set up of the charts, so you can easily see what is going on is essential. In this example, we get really sweet help from the 6 Reversal footprint chart.

Hope it helps,

MG

Friday and 5 Day Charts


Hey there guys,
Here are my charts and levels for Monday and the coming week. The levels I have listed on the daily chart give you a great view of the initiated selling on the way down from the high. I tried something a little different this week with my 5 day charts.

I have been studying in the IOAMT room the past 2 weeks and am expanding the way that I look at the markets. Here I am using the Market Profiles (colored the way Bill Duryea looks at them) instead of compressed 30 minute charts as I have been using. All of these levels are visible on my 30 minute footprint chart, so I don't really need them in this form for myself. I created this chart so that you could see the levels I am looking at. If the market challenges 780 this week, I will show you the levels above the market that I am interested in.

Have a great trading week.

MG